Follow us on:
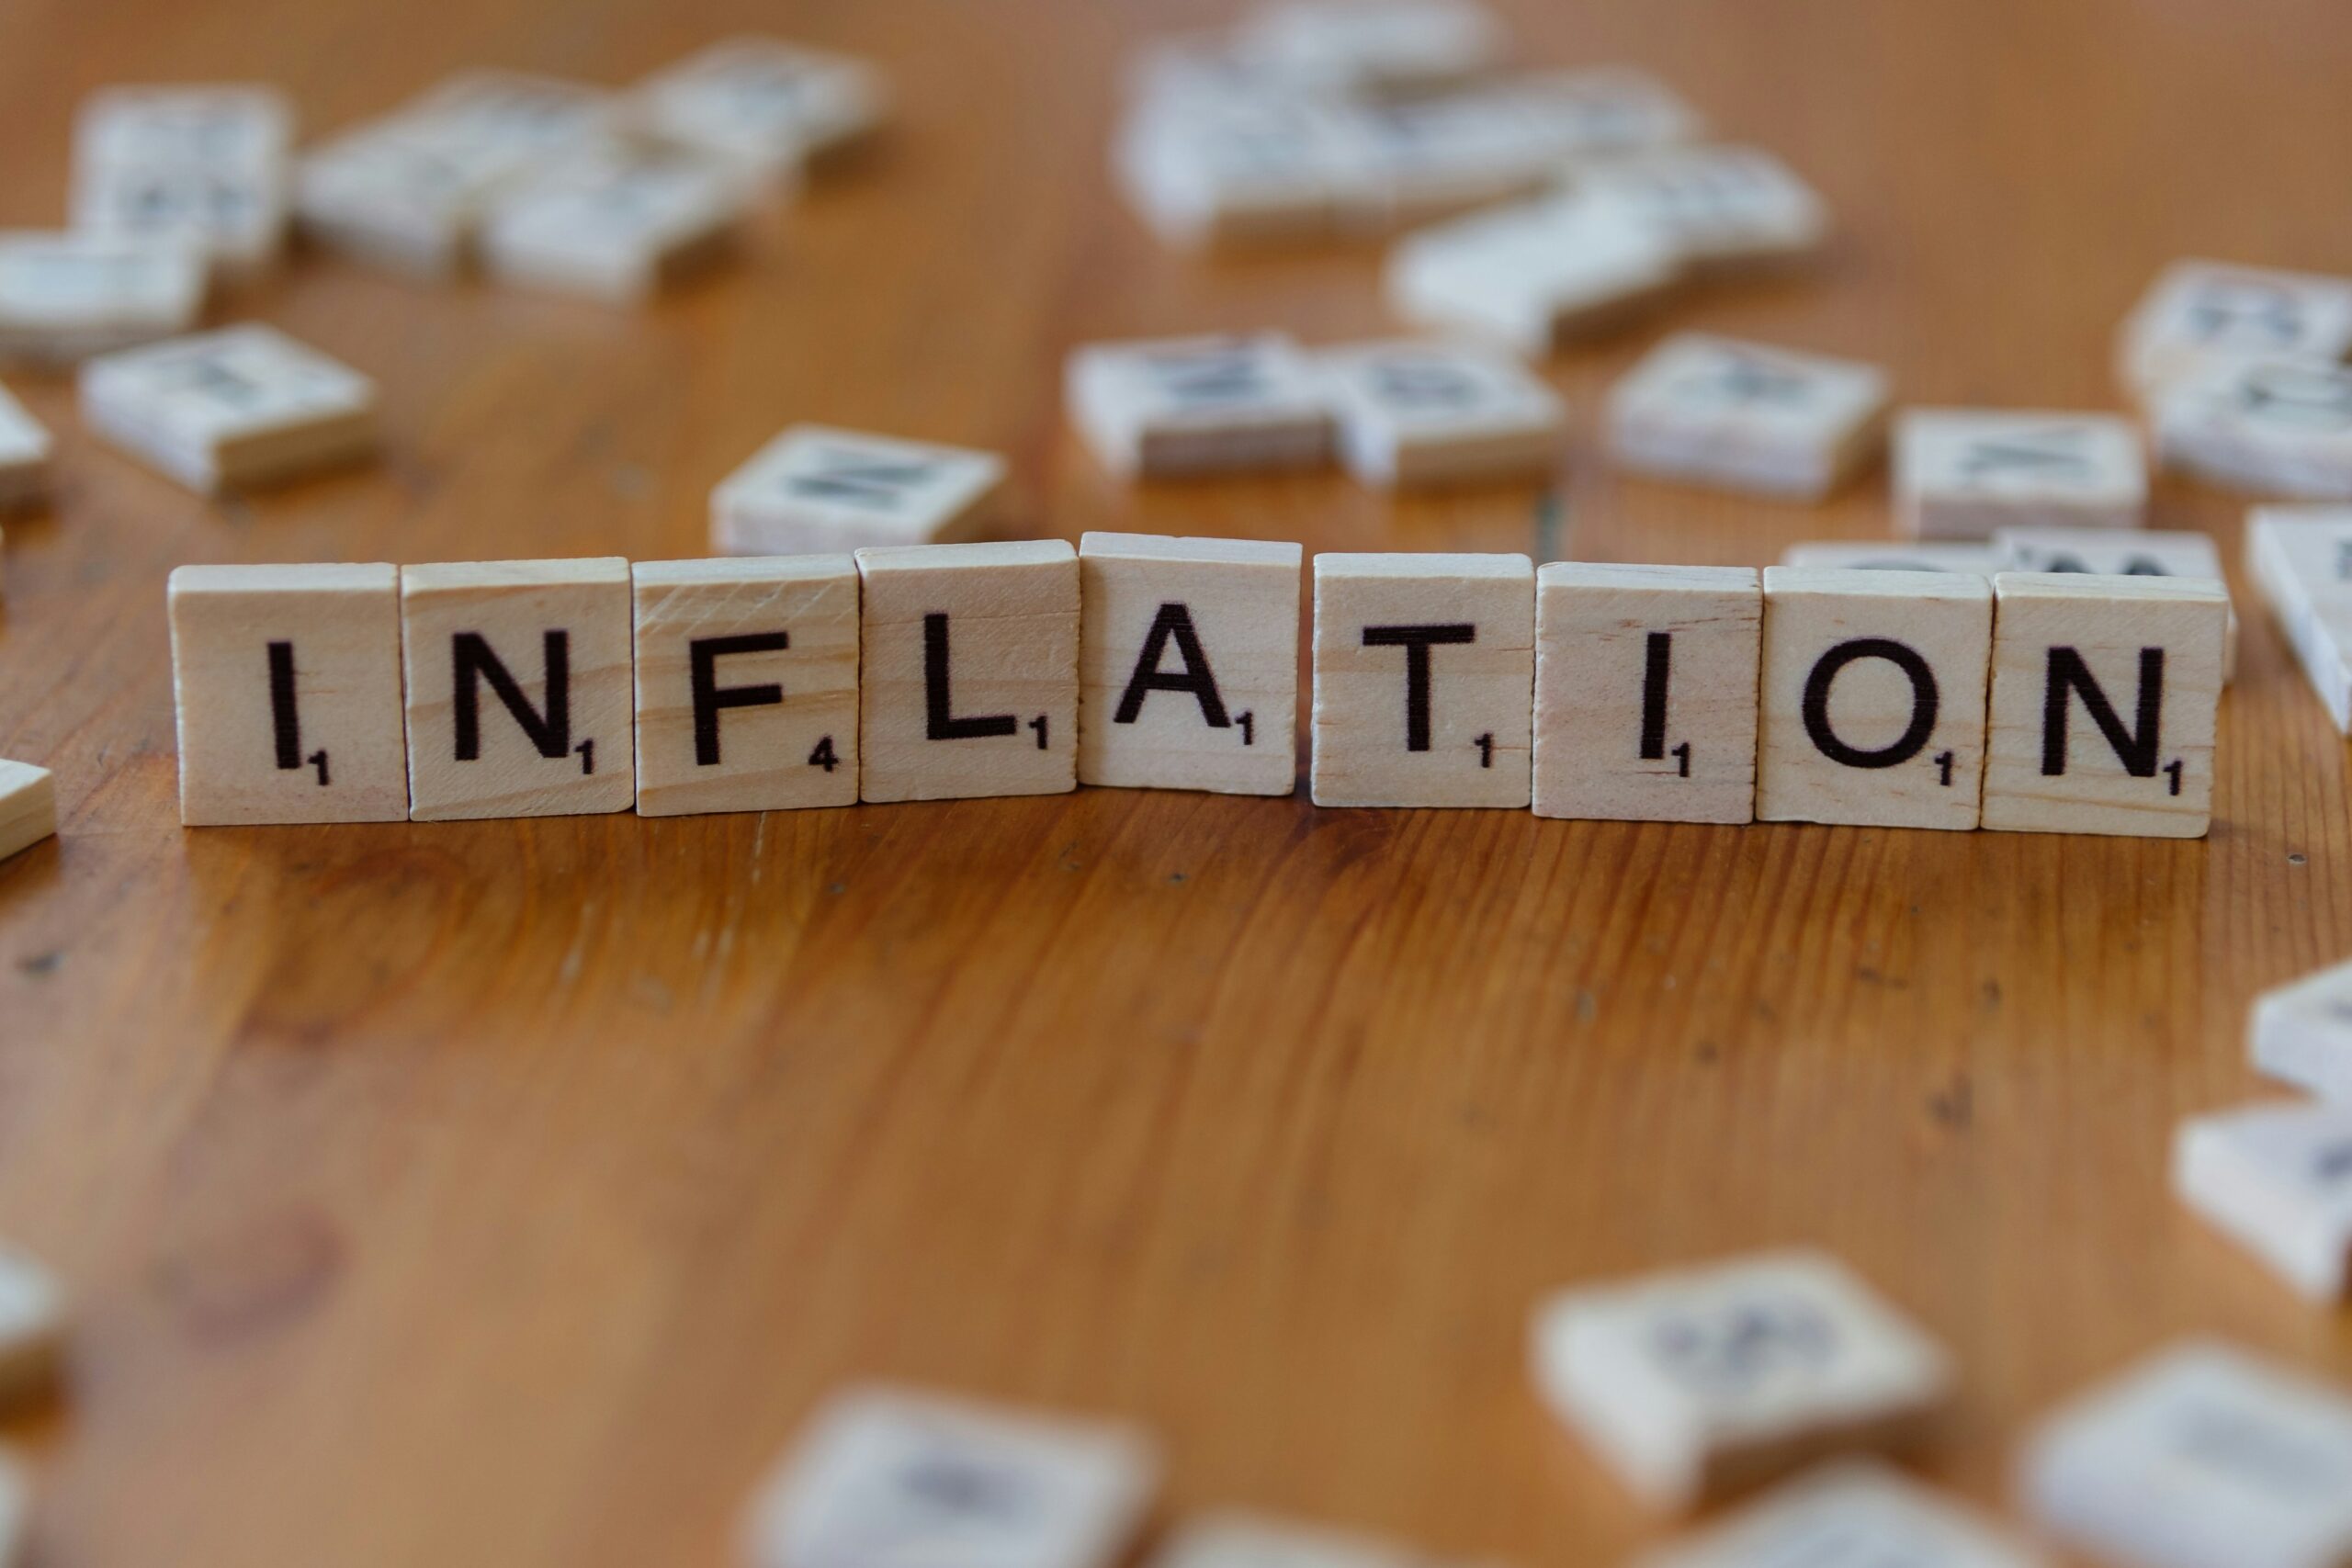
Economy Analysis | June 2026
What this article covers: The official Consumer Price Index (CPI) for April 2026 stands at 3.48%, well within the Reserve Bank of India’s 4% target. At the same time, food inflation under the Consumer Food Price Index has accelerated to 4.20%. Tomato prices in the CPI recorded 35.28% year-on-year inflation in April. Transport services for goods recorded 7.60% inflation in the same period. This article examines precisely why the headline figure and what a typical household feels are pulling in opposite directions, and what drives that gap.
Table of Contents
- The Core Disconnect
- Part I: What the CPI Measures and the New 2024 Base Year New base, revised weights, HCES 2023-24, COICOP 2018, 358 items
- Part II: What the April 2026 Data Actually Shows Division-wise inflation, high-inflation items, low-inflation offsets
- Part III: The Weight Problem: Why the Headline Understates Food Pressure Food weight reduction, housing weight increase, averaging effect
- Part IV: Urban vs Rural: Two Different Inflation Experiences Rural 3.74% vs Urban 3.16%, food spending share, divergence
- Part V: What the RBI Is Watching Repo rate held at 5.25%, June 2026 MPC decision, forward risks
- Key Takeaways
- Frequently Asked Questions
The Core Disconnect
On May 12, 2026, the Ministry of Statistics and Programme Implementation (MoSPI) released India’s Consumer Price Index (CPI) data for April 2026. The headline number was 3.48%. The government pointed to this as evidence of contained inflation. The Reserve Bank of India counts it as comfortable, since the number sits below the 4% target that anchors India’s monetary policy framework.
The same MoSPI press release, however, also showed this: tomato inflation at 35.28% year-on-year. Silver jewellery at 144.34%. Coconut copra at 44.55%. Gold and diamond jewellery at 40.72%. Transport services for goods at 7.60%. Food inflation overall at 4.20%, the third consecutive month of acceleration since the new CPI series launched with January 2026 data.
Both sets of numbers come from the same document. They describe the same economy in the same month. The question is not which number is right. Both are correct. The question is why they look so different, and what that gap means for the person reading a monthly grocery bill.
3.48%
Headline CPI inflation, April 2026 (MoSPI Provisional)
4.20%
Food inflation (CFPI), April 2026, up from 3.87% in March
35.28%
Tomato price inflation, April 2026 (YoY, CPI item weight: 0.4961)
-23.69%
Potato price inflation, April 2026. Offsets tomato in the index average
Part IWhat the CPI Measures and the New 2024 Base Year
The Basic Mechanism
The CPI tracks the change in price of a fixed basket of goods and services over time. MoSPI collects prices from 1,407 urban markets, including online markets, and 1,465 villages across all States and Union Territories each month. Field staff from the Field Operations Division of the National Statistics Office collect prices through personal visits on a weekly roster. The resulting index tells you the percentage by which the average price of the entire basket changed compared to the same month a year earlier.
The key word is “average.” CPI measures the weighted average price change across the full basket. Each item carries a weight that reflects its share in a representative household’s spending. Therefore, items with low weights can experience extreme price changes and barely move the headline number. Items with high weights that remain stable pull the headline down even when specific essential goods are expensive.
India’s New CPI Series: Base Year 2024
From January 2026, India switched from the CPI series using 2012 as the base year to a new series using 2024 as the base year. This is more than a routine rebasing. The PIB press release of February 12, 2026, confirmed that MoSPI built the new series on two foundations: the Household Consumption Expenditure Survey (HCES) 2023-24, which captured how Indian households actually spend money today, and the international Classification of Individual Consumption According to Purpose (COICOP) 2018 framework, which reorganises categories into 12 divisions rather than the old 6 groups.
The new CPI series also expanded the item basket from 299 items to 358 items. New additions include rural housing, online media and streaming services, value-added dairy products, pen-drives and external hard disks, and babysitter and attendant services. Items removed include VCR, VCD and DVD players, radio, tape recorder, second-hand clothing, CD and DVD audio and video cassettes, and coir rope. This reflects a genuine update: India no longer measures the cost of a DVD player in its national inflation index.
Why the survey year matters: The weights in the new CPI come from HCES 2023-24, not the old 2011-12 survey. In 2011-12, food consumed a very large share of Indian household spending. By 2023-24, rising incomes, urbanisation, and the expansion of services meant households spent proportionally less on food and more on housing, transport, health, and education. The new weights capture this shift. As a result, the CPI basket today looks structurally different from the one India used for over a decade.
The Most Important Weight Changes
| Category | Old Weight (CPI 2012 base) | New Weight (CPI 2024 base) | Change |
|---|---|---|---|
| Food and Beverages | 45.86% | 36.75% | Down by 9.11 percentage points |
| Housing (all sub-components) | 10.07% | 17.66% | Up sharply |
| Rural Housing | Not included | Now included for first time | New addition |
| Transport | Lower | 8.79% | Increased weight |
| Health | Lower | 6.10% | Increased weight |
Source: MoSPI PIB Press Release, February 12, 2026 (PRID 2227012) and Expert Group recommendations on CPI base revision.
The food weight reduction from 45.86% to 36.75% is the single most consequential structural change. Under the old series, food drove nearly half the index. Under the new series, food drives roughly 37%. The mathematical implication is direct: the same price shock in food now has a smaller effect on the headline CPI than it did before 2026.
Part IIWhat the April 2026 Data Actually Shows
Division-Wise Inflation: The Full Picture
The April 2026 MoSPI press release breaks inflation across 12 divisions under the new COICOP 2018 framework. This granular data tells a more complete story than the single 3.48% headline.
Inflation Rate by Division, April 2026 (%)
* Transport division shows -0.01% overall because vehicle purchase prices fell 4.81% year-on-year, dragging the division average below zero. However, within the same division, transport services for goods recorded +7.60% inflation. The two sub-groups offset each other in the average. The freight cost signal is explained in Part III. Source: MoSPI Annexure I and II, April 2026.
Note: The 17.66% figure for “Personal care, social protection and miscellaneous goods and services” is driven almost entirely by the silver jewellery component, which recorded 144.34% inflation in April 2026. This division has a relatively modest weight in the overall basket, so despite the large percentage, its contribution to headline inflation is limited.
The Five Items with Highest Inflation, April 2026
| Item | CPI Weight | Inflation, March 2026 | Inflation, April 2026 |
|---|---|---|---|
| Silver Jewellery | 0.3127 | 148.42% | 144.34% |
| Coconut: Copra | 0.0854 | 45.54% | 44.55% |
| Gold / Diamond / Platinum Jewellery | 0.6230 | 45.88% | 40.72% |
| Tomato | 0.4961 | 36.00% | 35.28% |
| Cauliflower | 0.2330 | 34.16% | 25.58% |
Source: MoSPI CPI Press Release for April 2026, released May 12, 2026.
The Five Items with Lowest Inflation, April 2026
| Item | CPI Weight | Inflation, March 2026 | Inflation, April 2026 |
|---|---|---|---|
| Potato | 0.7549 | -19.03% | -23.69% |
| Onion | 0.7006 | -27.78% | -17.67% |
| Motor Car and Jeep | 0.4665 | -6.91% | -7.12% |
| Peas and Chickpeas | 0.0516 | -7.88% | -6.75% |
| Air Conditioner | 0.0446 | -5.81% | -5.06% |
Source: MoSPI CPI Press Release for April 2026, released May 12, 2026.
The Averaging Effect in Plain Terms
Tomatoes recorded 35.28% inflation in April 2026. Potatoes recorded -23.69%. Both are vegetables. Both sit in the same CPI food basket. In the index, these two movements partially cancel each other out. A household that buys tomatoes every day and happens to already have potatoes in stock does not experience this cancellation. Their grocery cost simply went up because of tomatoes. The CPI, however, averages the two items within the vegetables sub-group, producing a blended figure that is lower than either the tomato or potato number individually.
Furthermore, potato has a higher weight (0.7549) than tomato (0.4961) in the basket. So the larger potato deflation numerically offsets more of the tomato inflation in the index calculation. This is statistically sound. It does not, however, reflect the kitchen experience of someone who primarily uses tomatoes in daily cooking.
Part IIIThe Weight Problem: Why the Headline Understates Food Pressure
Food Inflation Is Accelerating. The Headline Is Not.
The Consumer Food Price Index (CFPI) measures food inflation separately. In April 2026, the CFPI rose to 4.20%, up from 3.87% in March. This marks three consecutive months of acceleration. The CFPI moved from 2.13% in January 2026 to 3.47% in February, then 3.87% in March, and 4.20% in April. Each month, the reading has risen.
Yet the headline CPI for April is 3.48%. Food inflation already exceeds the headline. The reason the headline stays lower is that food carries a 36.75% weight in the new basket. Housing, which recorded inflation of only 1.71% in April at the combined level, now carries 17.66% weight. Low housing inflation pulls the headline number down significantly, even as food and specific essential goods become more expensive.
The structural dampening effect: Under the old CPI 2012 series, food and beverages carried 45.86% weight. A sharp rise in food inflation would dominate the headline. Under the new CPI 2024 series, food carries 36.75%. The same food price shock now has a measurably smaller mathematical impact on the headline. The food prices are not less painful to households. The formula simply weights them differently. This is the central reason why the 3.48% headline and the 4.20% food inflation figure can coexist in the same data release.
Transport Goods Inflation: A Hidden Cost Signal
Within the transport division, transport services for goods recorded inflation of 7.60% year-on-year in April 2026 at the combined national level. This is a significant number. It reflects higher freight costs across the supply chain. When goods transportation becomes more expensive, the cost of moving food, materials, and manufactured goods from production centres to retail markets rises. This ultimately shows up in higher retail prices across multiple categories, with a lag of weeks to months. The CPI transport division as a whole recorded -0.01% because personal transport (purchase of vehicles: -4.81%) pulled the overall division negative, masking the 7.60% goods freight inflation within it.
Why Your Personal Inflation Differs From the Headline
Each household effectively experiences a different inflation rate based on its own spending pattern. The national CPI is a weighted average across all 358 items for a representative household at the national level. If a household spends 50% of its monthly budget on food and food-related goods, its effective inflation in April 2026 is closer to the CFPI rate of 4.20% than to the headline 3.48%. If it spends heavily on electronics, motor vehicles, and air conditioners, all of which recorded deflation or near-zero inflation in April 2026, its effective inflation is lower than the headline.
Neither experience is “wrong.” Both are real. The headline CPI is a macro-level policy tool, not a household-level cost-of-living indicator. Treating them as equivalent is where the confusion enters.
Part IVUrban vs Rural: Two Different Inflation Experiences
The April 2026 MoSPI press release provides separate rural and urban CPI readings. These are not minor statistical footnotes. They reveal a meaningful divergence in the inflation experience across the country.
| Measure | Rural (April 2026) | Urban (April 2026) | Combined |
|---|---|---|---|
| CPI General Inflation | 3.74% | 3.16% | 3.48% |
| Consumer Food Price Index (CFPI) | 4.26% | 4.10% | 4.20% |
| CPI Index Level | 105.28 | 104.92 | 105.12 |
| CFPI Index Level | 104.17 | 104.78 | 104.39 |
Data note: All figures in the chart above are from the MoSPI CPI Press Release for April 2026 (Provisional), released May 12, 2026. This is the latest available data. May 2026 CPI data will be released by MoSPI on June 12, 2026 and is not yet published.
Rural CPI inflation at 3.74% is higher than urban CPI at 3.16%. This matters because rural households in India typically spend a larger share of their income on food compared to urban households. Furthermore, rural incomes tend to be less diversified and more exposed to agricultural and seasonal cycles. Therefore, food price pressures hit rural households proportionally harder in terms of their real purchasing power.
Additionally, the new CPI 2024 series includes rural housing for the first time. Rural housing inflation stood at 2.65% in April 2026, compared to urban housing inflation of 1.96%. This is a new data point that was simply invisible in the old series. Its inclusion reflects the growing rental market in rural India, where increased economic mobility has created measurable housing expenditure outside of urban centres.
Rural
Urban
Combined
Part VWhat the RBI Is Watching
The June 5, 2026 MPC Decision
The Reserve Bank of India’s Monetary Policy Committee (MPC) met from June 3 to June 5, 2026. RBI Governor Sanjay Malhotra announced the decision on June 5: the repo rate remains unchanged at 5.25%, with a neutral stance. The decision was unanimous.
This is the third consecutive hold following a cumulative reduction of 125 basis points since February 2025. The rate cut trail ran from 6.50% in December 2024 down to 5.25% through a series of cuts across February, April, and June 2025, after which the MPC paused.
Governor Malhotra specifically noted that CPI inflation remains below the 4% target but with an upward bias. He stated that elevated energy prices are feeding through into moderate growth and a rise in inflation. He also said the MPC will remain data-dependent and will closely monitor supply-side pressures going forward.
Why the RBI Held Rates
The decision to hold reflects a precise balancing act. On one side, the headline CPI at 3.48% is below the 4% target, which ordinarily gives the MPC room to cut. On the other side, food inflation has accelerated to 4.20%, transport services for goods are running at 7.60%, and external factors, including elevated global energy prices and rupee depreciation, are creating imported inflationary pressure. The RBI’s assessment, as expressed in Governor Malhotra’s June 5 statement, is that the cumulative 125 basis points of earlier cuts need time to transmit through the economy before adding more stimulus.
| Risk Factor | April 2026 Data Point | Direction for CPI |
|---|---|---|
| Food inflation (CFPI) | 4.20%, 3rd consecutive monthly rise (Jan: 2.13%, Feb: 3.47%, Mar: 3.87%) | Upward pressure building |
| Tomato inflation | 35.28% YoY | Elevated; expected to persist near-term |
| Transport services for goods | 7.60% YoY | Adds to supply chain costs |
| Housing inflation (combined) | 2.15% YoY | Low; dampening headline number |
| Potato inflation | -23.69% YoY | Significant offset in the food basket |
| Onion inflation | -17.67% YoY | Offset; but seasonal reversal possible |
| Transport division overall | -0.01% (vehicle deflation masking goods freight rise) | Headline masked; goods freight rising |
| Monsoon 2026 | Normal forecast (IMD) | Key variable for kharif food prices |
The monsoon is the most important forward variable: India’s food prices connect structurally to the monsoon cycle. A well-distributed south-west monsoon supports kharif crop production and typically moderates vegetable, cereal, and pulse prices from September onward. An erratic or deficient monsoon raises food inflation sharply through the October-February window. The India Meteorological Department’s 2026 forecast points to a normal monsoon, but historical data consistently shows that spatial and temporal distribution of rainfall matters more than the aggregate total. The RBI will watch IMD updates closely before its August 2026 MPC meeting.
Key Takeaways at a Glance
- The 3.48% headline is statistically valid but incomplete. MoSPI’s April 2026 CPI is confirmed at 3.48% under the new 2024-base series. However, this number is a weighted average across 358 items. It does not represent the cost-of-living experience of any single household.
- Food inflation is at 4.20% and accelerating. The Consumer Food Price Index (CFPI) rose from 2.13% in January 2026 to 4.20% in April, three consecutive monthly increases (January to February to March to April). Food inflation now exceeds the headline CPI, confirming that food prices are the primary pressure point right now.
- The new base year structurally mutes food shocks. The 2024-based CPI reduced food weight from 45.86% to 36.75%. The same food price pressures that would have moved the headline sharply in the old series now produce a more muted headline reading. The prices are equally painful. The formula weights them differently.
- Offsetting deflation masks individual price pain. Tomato inflation at 35.28% is partially cancelled in the index by potato deflation at -23.69% and onion deflation at -17.67%. These averages are mathematically correct. They do not describe a household that needs tomatoes but not potatoes.
- Rural India faces higher inflation than urban India. Rural CPI at 3.74% exceeds urban CPI at 3.16% in April 2026. Rural food inflation at 4.26% also exceeds urban food inflation at 4.10%. Since rural households spend more of their income on food, food price pressures affect rural purchasing power disproportionately.
- Transport services for goods rose 7.60% YoY. This is a supply-chain cost signal. Higher goods freight rates mean higher costs for moving food and materials to market, with delayed pass-through into retail prices across multiple CPI categories.
- The RBI held rates at 5.25% on June 5, 2026. Governor Sanjay Malhotra described CPI as below target but with an upward bias, and said the MPC will remain data-dependent. The August 2026 MPC meeting will be shaped primarily by the May and June CPI prints and the monsoon trajectory.
The Numbers We Quote and the Costs We Feel
Let me say plainly what this data is telling us. A 3.48% CPI headline is not a fabrication. MoSPI collects prices carefully. The new 2024-based series is a genuine methodological improvement over the old 2012 series. The use of HCES 2023-24 data, COICOP 2018 standards, and expanded digital price collection makes the index more representative of how India actually spends money today.
But a national weighted average across 358 goods and services, built to represent an imaginary median household, is a macro tool. It was designed for monetary policy decisions, not grocery budgets. When tomatoes are up 35%, potatoes are down 24%, and the headline reads 3.48%, that number is doing exactly what it was designed to do. It is averaging. The household paying more for tomatoes does not benefit from the potato average.
What the April 2026 data makes clear is that food inflation is building. The CFPI at 4.20% already exceeds the headline. Four months of consecutive acceleration is a trend, not noise. The RBI sees it, which is precisely why it held rates on June 5 rather than cutting further. The next two months of CPI data, along with the monsoon’s spatial distribution, will determine whether this inflationary build-up moderates or intensifies. If you want to know where the economy is actually heading, watch the food inflation number each month. It will tell you far more than the 3.48% ever will.
Frequently Asked Questions
The CPI is a weighted average across 358 items. Under the new 2024-based series, food and beverages carry a weight of 36.75%, reduced from 45.86% in the old 2012 series. As a result, even sharp increases in specific food items have a smaller mathematical impact on the headline than before. Additionally, items like potato and onion recorded significant deflation in April 2026 (potato at -23.69%, onion at -17.67%), which partially offset the tomato inflation of 35.28% within the food basket. Meanwhile, housing, which carries 17.66% weight in the new series, recorded only 2.15% inflation, pulling the headline lower. These averages and offsets produce the 3.48% headline from within the same data that shows tomato prices up 35%.
India switched from CPI base 2012 to CPI base 2024 in January 2026, as announced by MoSPI via PIB on February 12, 2026. The key changes are: the weights now come from the Household Consumption Expenditure Survey (HCES) 2023-24 instead of the old 2011-12 survey; the item basket expanded from 299 to 358 items; categories follow the international COICOP 2018 classification with 12 divisions replacing the old 6 groups; rural housing is included for the first time; and price data is collected digitally through Computer Assisted Personal Interview (CAPI). The food and beverages weight fell from 45.86% to 36.75%, reflecting the declining share of food in Indian household spending as incomes rose. The housing weight rose sharply from 10.07% to 17.66%.
Yes. According to provisional MoSPI data for April 2026, rural CPI inflation stands at 3.74% while urban CPI stands at 3.16%. Rural food inflation (CFPI) is 4.26%, slightly above urban food inflation of 4.10%. Rural households typically allocate a larger share of their income to food. Therefore, higher food inflation affects rural purchasing power more severely than urban purchasing power in proportional terms. The new CPI 2024 series also includes rural housing inflation for the first time. In April 2026, rural housing inflation was 2.65% against urban housing inflation of 1.96%, reflecting the growing rental market in rural India captured by the expanded HCES 2023-24 survey.
The RBI’s Monetary Policy Committee held the repo rate unchanged at 5.25% on June 5, 2026. The decision was unanimous. Governor Sanjay Malhotra stated that CPI inflation remains below the 4% target but with an upward bias. He noted that elevated energy prices are reflecting in moderate growth and rising inflation. The MPC paused after cutting rates cumulatively by 125 basis points since February 2025 (from 6.50% to 5.25%). The rationale for the hold is that earlier rate cuts need time to transmit through the economy. Adding more stimulus when food inflation is accelerating and energy costs are elevated carries the risk of stoking broader price pressures. The MPC will remain data-dependent, with the next meeting in August 2026.
Three indicators from official government sources tell you the most. First, the monthly CFPI (Consumer Food Price Index) released by MoSPI on the 12th of each month: this tracks food inflation separately from the headline and will signal whether the four-month acceleration trend continues. Second, the IMD (India Meteorological Department) monsoon updates: a well-distributed south-west monsoon supports good kharif production and moderates food prices from September onward, while an erratic monsoon raises food inflation through the October-February period. Third, the RBI MPC statements: Governor Malhotra’s language around the “upward bias” to inflation and the phrase “data-dependent” signals that the August 2026 meeting will be closely influenced by May and June CPI prints. Together, these three sources will give you a more accurate picture of inflation’s direction than any single headline number.
Disclaimer: This article is for informational and educational purposes only. Nothing in this article constitutes investment, tax, or financial advice.